Environmental Report 2016
Material Flow (Japan/Overseas)
The following mass balance chart compares the resource and energy inputs and the environmental impact (output) arising from business activities at the JAE Group's domestic sites.Mass Balance at Domestic Production Sites
In fiscal 2015, a number of indices declined compared to the previous fiscal year in line with lower production volumes. That said, as heat generation for space heating was partly switched from heavy oil boilers to heat pumps, and other factors, the volume of electric power consumed rose slightly.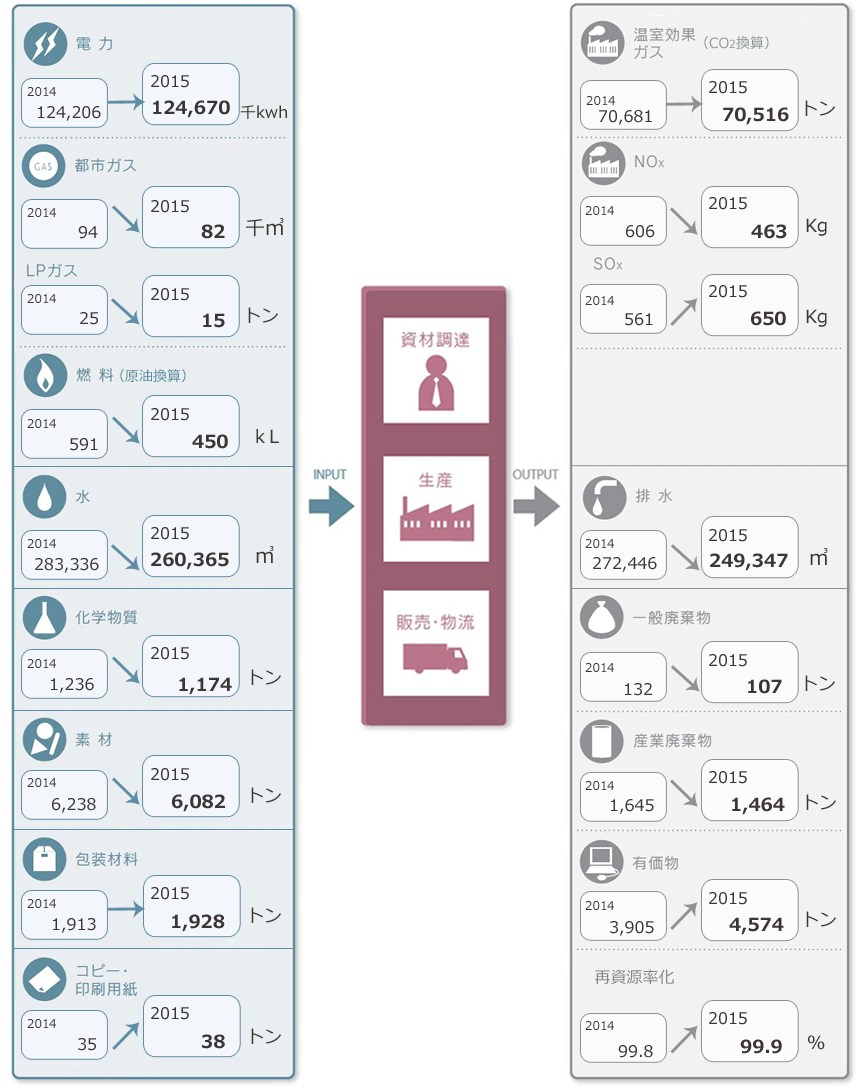
Mass Balance at Overseas Production Sites
This page introduces the environmental impact of the JAE Group's overseas production sites.Quite a few items in fiscal 2015 rose slightly compared to the previous fiscal year, in terms of both input materials and emissions.
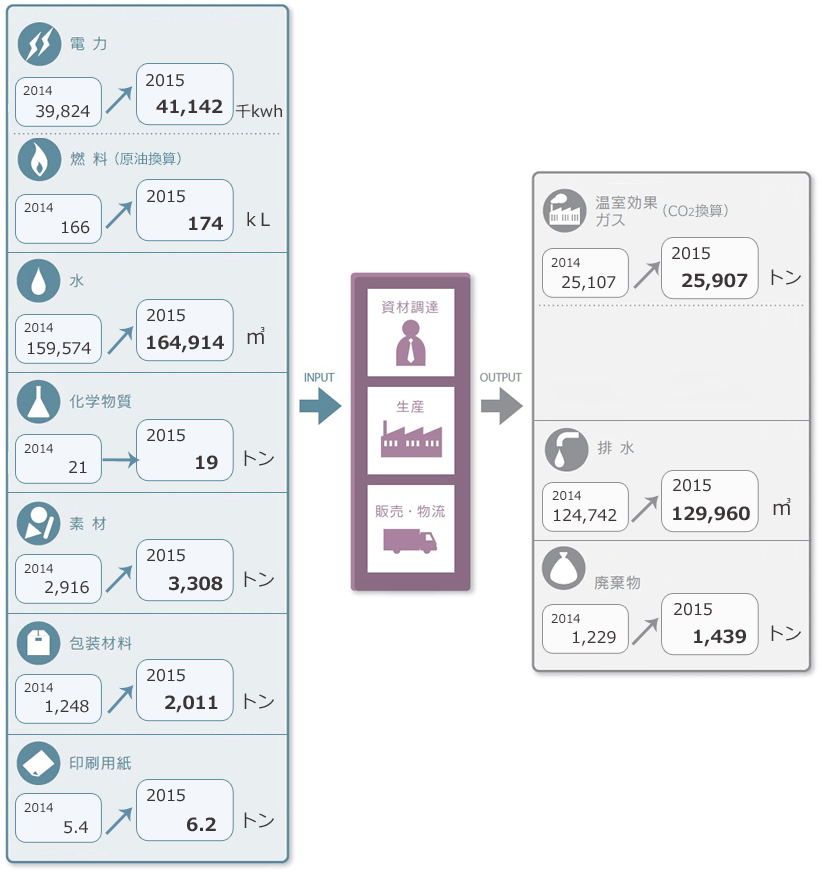
The items mentioned here differ to some extent from the classifications used for production sites in Japan. For that reason, there may be cases where data is missing from some production sites.